

Curios to learn about your year to date profit and loss statement?
Your profit and loss statement (P&L) is one of the key financial documents that keeps you informed and allows you to make critical decisions for the growth of your business. This includes essential decisions that drive revenue growth while also being mindful of the expenses and costs incurred. Working with your bookkeeper, you can customize your P&L to reflect your business model, particularly the expenses and revenue sources unique to your company.
To truly understand where your business is headed and to find the trends that indicate the financial health of your business, you need to get comfortable comparing P&L statements from similar periods of time. For instance, some businesses opt to run P&L statements every quarter and then compare the same quarters from previous years to get an idea of the trends and changes that have occurred. With that in mind, let’s dive into what a year-to-date P&L statement is and how you can use it to understand the health of your company better.

What is a Year to Date Profit and Loss Statement?
A year-to-date profit and loss statement is a financial report that provides a snapshot of your company’s financial performance for the current year. This statement summarizes the revenue, cost of goods sold, gross profit, expenses, and net income for your company from the beginning of the year to the current date. When you run this P&L statement, you get an idea of where your business is right at the current moment, which lets you know whether you are on track regarding your expenses and budget for the year or if adjustments are necessary.
Components of a Year-to-Date Profit and Loss Statement
A year-to-date P&L statement summarizes the revenue, costs, and expenses of your business, regardless of the type of business you own, and includes all these categories from the beginning of the year to the date that you run the report. Here is an overview of the different categories that you can find on your P&L statement.
Revenue
Your revenue will include all the income that comes from doing business, which includes product sales and services provided to your clients. This income will be at the top of your year-to-date P&L statement.
Expenditures
Expenses are typically purchases made to increase the revenue of a business, but expenditures are made to improve the long-term value of your business. There are two types of expenditures.
The first is capital expenditures, which are one-time purchases, such as vehicles, machinery, or real estate. These can also be known as fixed assets. For instance, if your company purchases a new warehouse for production, shipping, and storing inventory, you have added value to your business. That means on your P&L statement, this type of expense is not likely to appear, but it will be on your balance sheet, which is a list of what your company owns and what is owed.
The second is a revenue expenditure. You might buy a piece of equipment that requires regular service and loses value over time. The value lost, along with the maintenance, would be a revenue expenditure that is written off over the lifetime of the equipment.
The difference is that a capital expense can continue to deliver value for the company even after it is paid for, but maintenance and depreciation is the revenue expenditure.
It is also important to note that not all expenditures are expenses since expenses tend to be related to generating revenue and the daily operations of your business. Typically, your expenditures will not be found on your P&L, but they will appear on your balance sheets.
Direct Costs/Costs of Goods Sold
The direct costs of goods sold (COGS) include all the costs associated with producing your products and services for sale to your target market. These COGS can include the labor, purchase of raw materials, and inventory.

Gross Profit (and Gross Margin)
Gross profit and gross margin are concepts used to measure the profitability of your business. To determine gross profit, you subtract the COGS from the net sales. On the other hand, gross margin is the ratio of gross profit to net sales, expressed as a percentage. People tend to use gross margin as a way to compare the profitability of different businesses within your industry or even the profitability of different industries.
Operating Expenses (OPEX)
Your expenses will include all the operation costs and administrative expenses associated with running your company, including utilities, rent, payroll, and insurance. Fixed operating expenses include rent and payroll, while variable operating expenses might include sales commissions or marketing costs. Note that these expenses do not include your COGS, since those are a separate item on your P&L.
Depreciation
While your capital expenditures do not appear on your P&L, some of them can be depreciated over time, and that will appear on your P&L. Rather than having a large expense in one year, depreciation allows you to deduct the value across multiple years during the life of the purchase, allowing you to have a greater level of control over your expenses. Straight-line depreciation takes the total cost of the item and divides it by its lifespan to expense a portion on your P&L.
However, it is important to note that depreciation applies only to physical assets. Amortization is the same concept, but it applies to intangible assets like trademarks and permits. Calculating depreciation depends on a variety of factors, such as what the IRS permits based upon the type of expenditure.
EBIT (Earnings Before Interest and Tax)
EBIT indicates a company’s profitability by calculating the revenue minus expenses, excluding tax and interest. It can also be referred to as operating earnings, operating profit, and profit before interest and taxes. Essentially, you are measuring your company’s net income before income taxes and interest expenses are deducted. This calculation also highlights how well your core operations are performing.
By ignoring taxes and interest, you can identify your company’s ability to pay down debt, fund ongoing operations, and its ability to generate enough earnings to be profitable. While this might be reported on your annual P&L as operating profits, EBIT is not a GAAP metric, so it is not labeled on the P&L as such.

EBT (Earnings Before Tax)
EBT allows you to calculate your profitability after interest payments are made but before taxes and appears as a line item on your P&L statement. It is also referred to as your pre-tax income or profit before taxes. You can calculate your EBT by subtracting all expenses excluding taxes from revenue. With EBT, you remove the effects of taxes when comparing businesses within an industry. EBT is also a pure ratio, meaning it uses the numbers ground exclusively in your P&L. To locate EBT, look above your net income line item.
Net Income: Profit or Loss
Net income is your company’s profit after business expenses are accounted for, and to calculate it, you have to subtract all expenses, including taxes, depreciation, operating expenses, and COGS. This is typically found on the last line of your P&L statement, which is why it is referred to as your bottom line. The net income formula is:
Net income = Total Revenue – Total Expenses
It gives you a better understanding of your company’s financial health and represents its profitability. After all, you might have a large amount of income, but if you don’t have the full scope of your business expenses, then your financial view is incomplete. You could believe your business can afford to take on additional capital expenditures when your net income says differently.
Analyzing a Year to Date Profit and Loss Statement
A P&L statement summarizes the revenues, costs, and expenses incurred during a specific period of time. Your Year to Date P&L statement will cover all this information from the beginning of the year to the date you run the report. It highlights the ability or inability of your company to generate a profit, either by increasing revenue, reducing costs, or both.
Performing a P&L Analysis
To analyze your year-to-date P&L, you should follow these basic steps:
- Review the top line
- Analyze the COGS
- Analyze operating expenses
- Calculate gross profit
- Analyze net income
- Compare with industry benchmarks
By doing so, you can get a clear idea of your profitability and overall financial health. Having this analysis can assist in strategic financial planning for long-term growth and expansion.
How to Prepare a Year-to-Date Profit and Loss Statement?
While your accounting software can easily create a year-to-date P&L statement, if you are not quite ready to take on accounting software, you can follow these steps to prepare your P&L.
- Prepare your company’s revenue for each quarter up to the date you want the report.
- Itemize your company’s expenses for each quarter.
- Subtract your overall expenses from gross profit to get your EBIT per quarter.
- Account for any interest and taxes, then subtract these from the EBIT.
- Determine if your company is operating at a profit or loss.
Once you follow these steps, then you can determine where changes might be necessary to increase profitability and reduce potential losses.

Year to Date Profit and Loss Statement Examples
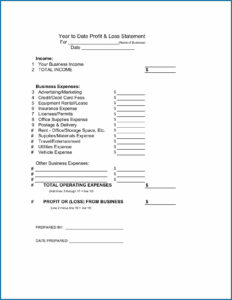
To determine whether your P&L is following the right format, below are a few examples of what a year-to-date P&L statement should look like.
The Simplest YTD P&L Example
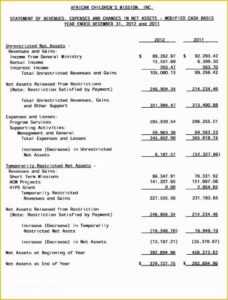
A More Typical Real Life YTD P&L Example
Frequently Asked Questions
What do you get from a company’s profit and loss statement?
You can determine if your company is profitable or not, as well as areas where you can make changes to improve profitability, either by increasing revenue, decreasing expenses, or both.
What is a projected profit and loss statement?
A projected profit and loss statement is a financial forecast showing the income generated by a company over one or more financial years. Essentially, you are projecting how much money the company will generate by selling products or services and how much profit it makes from these sales. You can also use it to evaluate your company’s growth and increase turnover, while also creating a financial forecast of your company.
Are all companies required to prepare P&L statements?
Publicly traded companies are required to prepare P&L statements, but privately held companies are not legally obligated to do so. However, P&L statements are advisable for all companies because they provide a systematic way to obtain a clear picture of your financial performance, thus helping you to make informed strategic financial decisions for your company.
Why are profit and loss (P&L) statements important?
A profit and loss statement provides information about a company’s ability or inability to generate profit by increasing revenue, reducing costs, or both. These statements can be used to analyze the financial health of your company. With the balance sheet and the cash flow statement, P&L statement provide an in-dept look at your company’s overall financial performance.
What Is AccountsBalance?

AccountsBalance is a monthly bookkeeping service specialized for agencies & SAAS companies.
We take monthly bookkeeping off your plate and deliver you your financial statements by the 15th or 20th of each month.
You’ll have your Profit and Loss Statement, Balance Sheet, and Cash Flow Statement ready for analysis each month so you and your business partners can make better business decisions.
Interested in learning more? Schedule a call with our CEO, Nathan Hirsch.
And here’s some free resources:
In Summary
A year-to-date P&L statement gives you a tool to see your company’s financial performance in real-time but also gives you a tool to compare it’s performance to other businesses within your industry. By taking the time to create a P&L statement, you give yourself the tools to find areas where adjustments might be necessary. Working with your accounting software and your bookkeeper, you can access these reporting tools and use them effectively.